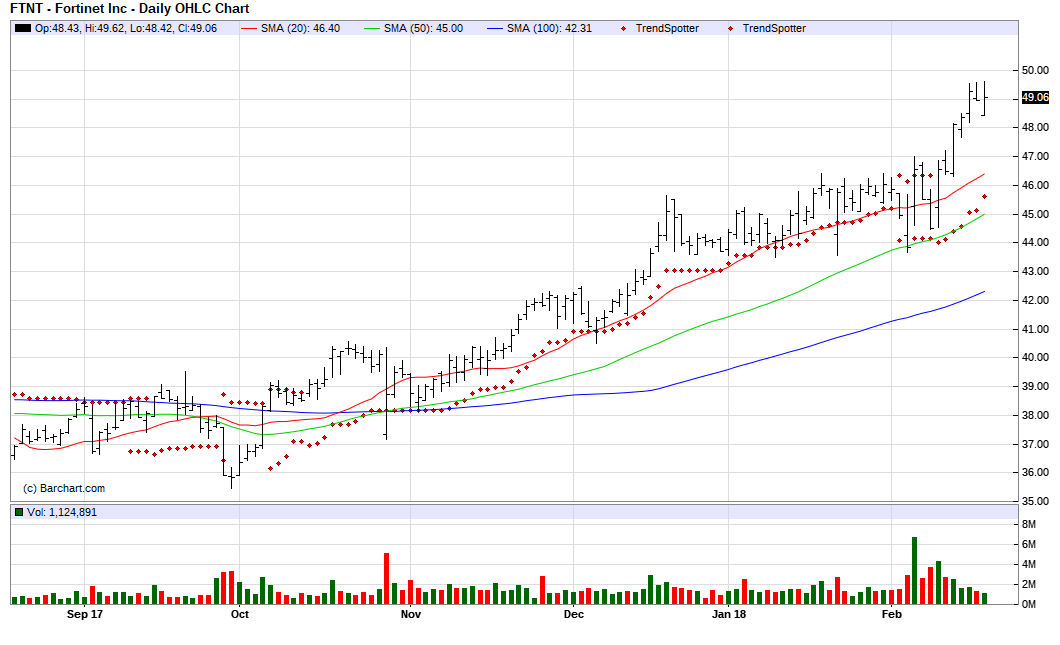
The Chart of the Day belongs to Fortinet (FTNT). I found the computer equipment stock by using Barchart to sort today's New 52 Week High list first by the most frequent number of new highs in the last month, then again for technical buy signals of 80% or more. I then used the Flipchart feature to review the charts for consistent price appreciation. Since the Trend Spotter signaled a buy on 2/9 the stock gained 5.41%.
Fortinet, Inc., headquartered in Sunnyvale, California, is a provider of network security appliances and Unified Threat Management network security solutions to enterprises, service providers and government entities worldwide. Its solutions are designed to integrate multiple levels of security protection, including firewall, virtual private networking, antivirus, intrusion prevention, Web filtering, antispam and wide area network acceleration. Through its products and subscription services, the company provides integrated protection against dynamic security threats while simplifying the IT security infrastructure. Its solution incorporates the application-specific integrated circuits, hardware architecture, operating system, and set of associated security and networking functions to defend against multiple categories of IT security attacks without impacting network performance. Its flagship UTM solution consists of FortiGate appliance product line and FortiGuard security subscription services.
Barchart's Opinion trading systems are listed below. Please note that the Barchart Opinion indicators are updated live during the session every 10 minutes and can therefore change during the day as the market fluctuates. The indicator numbers shown below therefore may not match what you see live on the Barchart.com web site when you read this report.
Barchart technical indicators:
- 96% technical buy signals
- Trend Spotter buy signal
- Above its 20, 50 and 100 day moving averages
- 12 new highs and up 6.63% in the last month
- Relative Strength Index 65.66%
- Technical support at 48.73
- Recently traded at 49.04 with a 50 day moving average of 45.00
Fundamental factors:
- Market Cap $8.21 billion
- P/E 88.00
- Revenue expected to grow 14.10% this year and another 12.40% next year
- Earnings estimated to increase 35.60% this year, an additional 17.00% next year and continue to compound at an annual rate of 23.75% for the next 5 years
- Wall Street analysts issued 6 strong buy, 15 by, 7 hold and 2 under perform recommendations on the stock