More on the Retire In Peace (RIP) Portfolio
Jun. 20 2016, 11:26 AM ET - by VF member cancerfixer (1096
This is my 4th post in a series about Bruce Miller�s income-only investing strategy. The first post is here: https://www.valueforum.com/forums/show.mpl?keywords=1460037156.97.57&so=201604
My last post on 5/3/16 covered his methodology and selection criteria: (https://www.valueforum.com/forums/show.mpl?keywords=1462315789.9.686&so=201605).
Another post (https://www.valueforum.com/forums/show.mpl?keywords=1463501476.72.46&so=201605) introduced a spreadsheet designed to assist the evaluation of companies being considered for inclusion in an income portfolio.
In this post I will go through the stock selection process one step at a time to see how hard it is to use his techniques. (The short answer: it should take at least 20-30 hours of work to build a portfolio from scratch using individual stocks. And periodic monitoring and maintenance will take a few hours every month. It can probably be done faster using ETFs, CEFs or mutual funds.)
You will recall from the 5/3/16 methodology post that Miller uses 7 �factors� to help him find suitable companies to include in an income-only portfolio. These factors apply mostly to analyzing individual companies, as opposed to allocating between different income groups with an ETF or mutual fund.
The essential first factors are to
(1) determine what yield you need,
(2) search for securities with long histories of paying dividends,
(3) focus on the ones that consistently increase their dividends and then
(4) use common sense to evaluate the nature of the company business (product, ethics, presence of a �moat�, and so forth). These initial 4 steps are the minimum necessary to find good individual income stocks.
Highly recommended additional selection factors include
(5) Analyze company financial data to evaluate the company�s ability to continue its dividend and dividend growth trajectory and
(6) look for companies that steadily increase Return On Invested Capital (ROIC). This is accomplished by looking at the company�s financial statements and performing some simple math on GAAP data. The final factor was to
(7) consider the tax ramifications of an investment in your particular circumstances.
[Security financial analysis (5-6 above) is labor intensive. I created the Retirement Income Analysis Spreadsheet to automate the process (or� more honestly... I am retired with time on my hands and like to write VBA code in Excel spreadsheets - it�s therapeutic). Today, when I re-checked that spreadsheet post, the spreadsheet link appeared to be broken. Perhaps that�s just as well because I have spent the last month modifying it and it still needs some work. Rather than re-attach a buggy spreadsheet, I�ll just paste some outcome reports here. The modified and debugged spreadsheet will be posted later.]
Miller doesn�t go over diversification in his �factor� discussion, but later in the book he talks about allocating investments between 18 Income Groups. I have re-printed his recommended Income Groups and his criteria for allocation between them here:
Bruce Miller Income Groups

Allocation Criteria
No more than 3% in an individual stock or MLP. A portfolio of individual stocks should have a minimum of 34 holdings (less if ETFs or mutual funds are used)
No more than 20% in any one income group. A portfolio should include holdings in at least 5 income groups
No more than 20% in any single ETF, OEF or CEF. If an ETF is limited to one income group it should be included in the total holdings for that group
No more than 40% of the portfolio�s income should come from bonds or preferred stock of any one income group. So a portfolio of entirely bonds or preferreds should have bonds/preferreds from at least 3 income groups. Fewer income groups are allowed for bonds & preferreds because of their lower income risk.
With that information in mind, here is the process of building an income-only portfolio from the ground up...
Finding our first income stock
Using Consumer Staples as an example I will go through the process of finding an individual stock to populate that basket in the portfolio. I�ve previously decided on a 5% total portfolio target yield to satisfy my income needs, so I am looking for companies that can approach that yield.
Miller�s Evaluation Step/Factors 2-3
The next step in the screening process is to look for Consumer Staples companies using one of these sites:
(http://www.dripinvesting.org/ (downloadable, sortable spreadsheets);
http://www.longrundata.com/ (S&P500 Div Aristocrat list, model portfolio);
http://www.dividend.com/ (free screening by sector, yield and more); http://www.nasdaq.com/quotes/dividend-history.aspx; (free screener, useful for Prfd history)
www.yahoofinance.com. (mostly used for basic info, historical prices & dividends).
The Dividend.com screener is easiest to use, although the NASDAQ screener & DripInvesting spreadsheet are more comprehensive. All three produced more or less the same results when looking for Consumer Staples/Goods stocks. Dividend.com showed me 6 Consumer Goods stocks that had at least a 3% dividend yield with a 10+ year history of dividend increases:
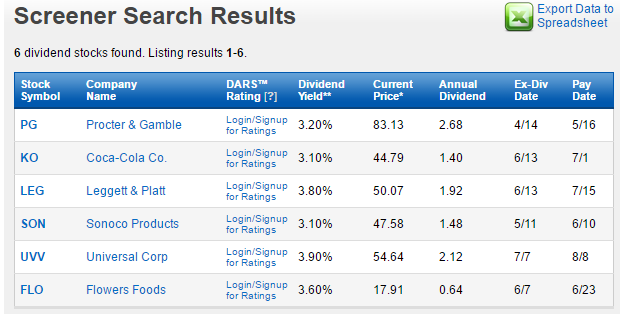
There were no stocks yielding above 4% and none with a 25 year history of div increases. Not exactly what we had hoped for, but this sector almost never pays big dividends. We can reach for return elsewhere. This list is good enough to for an exercise in analyzing individual stocks.
Miller�s Factor 4: Common Sense:
Clicking through the stock symbol links on Dividend.com brings us to basic info about each company and links to even more detailed information. You could spend hours reading all this stuff.
Most know what PG, KO and SON do, but it�s interesting reading. I�m OK with any of these.
I did not know anything about LEG, but learned that It is a US company with a POR of 75.9% and four segments: Residential Furnishings; Commercial Fixturing & Components; Industrial Materials; and Specialized Products. The furnishings division is �the leading supplier of a wide range of products and components for the home, including: mattress springs, pocketed coils, power foundations, bed frames, ornamental beds, bedding accessories, carpet cushion, and more� - and that�s a small part of what that division does. When the Mattress Factory orders springs for their springs, this is who they call. I had no idea� LEG�s business is affected by the cost of raw materials, particularly steel and is affected by foreign currency fluctuations, as many of its operations are global. This is basic, indispensible US industry. OK. It can stay on the list.
I had no idea what UVV did & was surprised to find that it engages in �selecting, buying, processing, packing, storing, shipping, and financing leaf tobacco for sale to, or for the account of, manufacturers of consumer tobacco products worldwide�. I have a problem with tobacco, so UVV has been scratched off my list.
You might not be familiar with their corporate name, but everyone should be familiar with FLO�s products. A huge bakery company, they produce Nature's Own, Cobblestone Mill, Sunbeam, Blue Bird, and Mrs. Freshley's brands, among others. Their POR is a healthy 63.4% and it seems pretty obvious that people need bread - even during recessions. Good safe stock to own.
So a common sense review has narrowed our prospective investment list down to PG, KO, SON, LEG and FLO.
Miller�s Factors 5-6: Dividend Sustainability
Dividends come from net operating cash flow (NetOpCF), so we are looking for increasing annual revenues in a company that is also not spending too much of its NetOpCF on interest (<~30%) or dividends (<~30-50%) and is able to gradually increase shareholder equity. So we need to know these numbers. Good luck figuring them out from quarterly statements. To a non-accountant, quarterly financial reports can be maddeningly complex. Terminology and organization are not as standard as one would think. Fortunately, Morningstar's tables of quarterly financial information seems to be standardized, and their information is free.
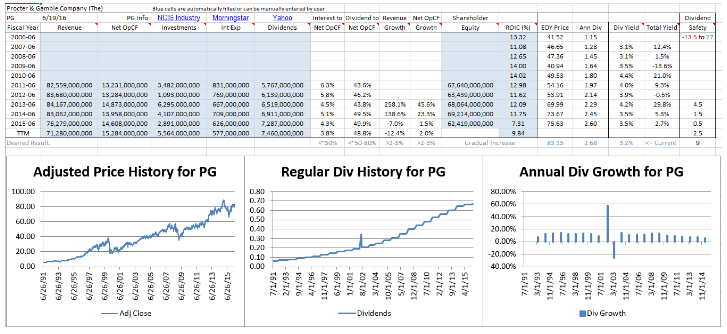
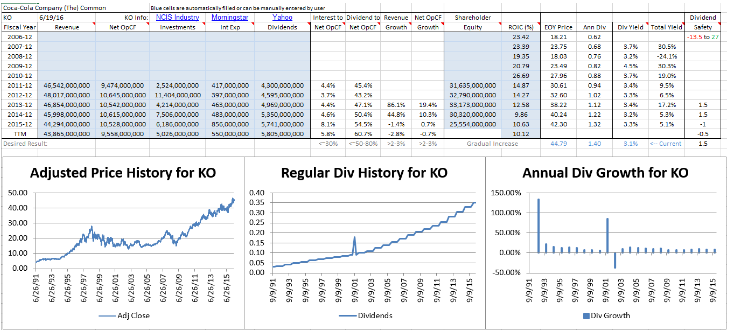
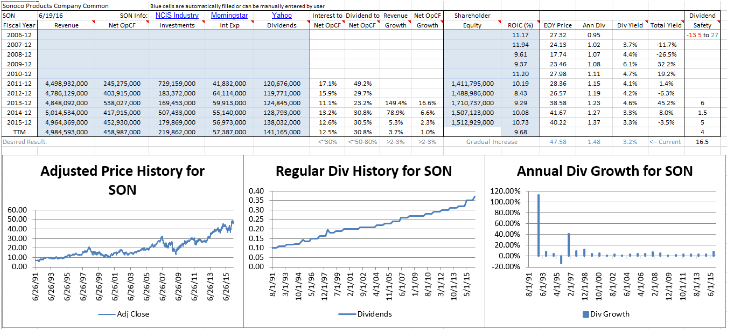
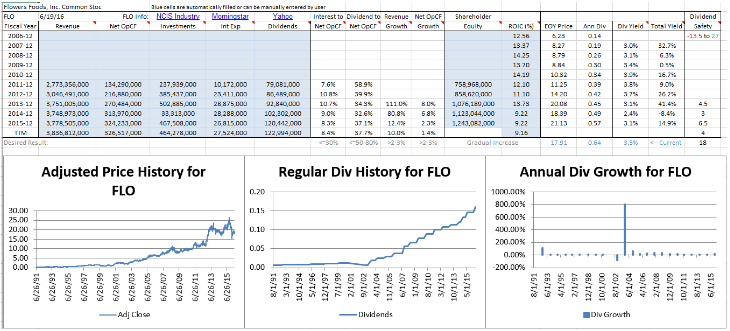
Miller�s method of evaluating dividend sustainability is time consuming. The RIP spreadsheet automates and speeds the process up. It pulls data from Morningstar and Yahoo sites, crunches some numbers, and draws 3 graphs. Since I first posted the spreadsheet I have fixed a few bugs and added a dividend �safety� scoring system Based on Miller�s criteria that ranks dividend sustainability from -13.5 (Sell, Mortimer, Sell!) to 27 (wow - buy this one!). This scoring makes company comparisons a little easier.
I have analyzed all 5 tickers with the spreadsheet and pasted the output below with some commentary. Each analysis takes about 2-3 minutes before the computer spits out results, so it�s a big improvement over the manual method of looking stuff up, cutting, pasting, and crunching numbers. Please note that only 5 years of financial data was used. A paid subscription to Morningstar would allow a full 10 year analysis, but 5 years seems adequate for our purpose. (Sorry if the screen shots are a little small. Try <Ctrl><+> to enlarge your web browser size or look at the summary table below the screen shots).:
Procter & Gamble
Coca-Cola
Sonoco
Leggett & Platt

Flowers Foods
Here�s a summary of the major metrics:
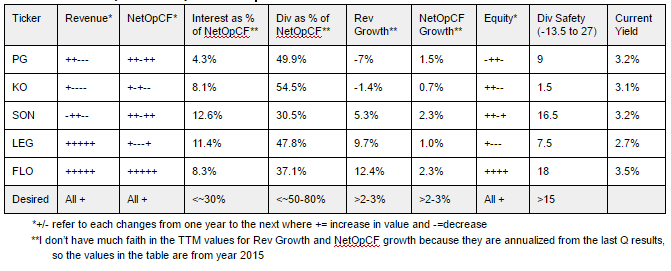
A review of the graphs and tables makes it clear that FLO is the clear winner, with SON a reasonable second choice. FLO has consistently increasing revenue, NetOpCF and shareholder equity. In fact, it's revenue growth of 12.4% in 2015 is a little worrisome. Sometimes companies can get ahead of themselves and grow too fast in which case some slower quarters can be expected later on. But otherwise the numbers look good. It�s interest expenses are very low and dividends as a % of NetOpCF only 37.1%. Dividend safety is, thus, very good - and FLO has the best dividend yield of the 5 as well. It seems FLO is good stock to hold for dividend income.
Wash, Rinse, Repeat
We have now identified 1 or 2 stocks out of a required 34 to fill out a well balanced and diversified Income-Only portfolio using Miller�s methods. It took me about an hour to go through the screening and analysis process the first time (writing this post took far longer). Repeat this process for the other 17 income groups and the process gets easier and faster. So it seems 20-30 hours should be sufficient to build out a complete income portfolio with 25-34 positions. Then all you have to do is follow-up each holding every quarter looking for changes that merit an adjustment (sell a deteriorating position and replace it with something better).
Performance
How does Miller�s strategy work over the long term? Not too badly. His published portfolio, included near the end of his book (page 192) includes 53 securities and produced an income of about $70,618/year (investment value & cost basis not provided). I will post a backtest graph of this performance once I modify the spreadsheet to handle preferred stock historical dividends, which made up 23% of his holdings.
Here is a test of a similar, but less diversified portfolio of 10 income stocks that uses an almost identical strategy (ADM, FLO, ED, SCG, T, VZ, CMI, EMR, JCI, SO)(see http://www.talkmarkets.com/content/us-markets/the-10-best-dividend-stocks-for-retirement?post=88037)
produced these results:
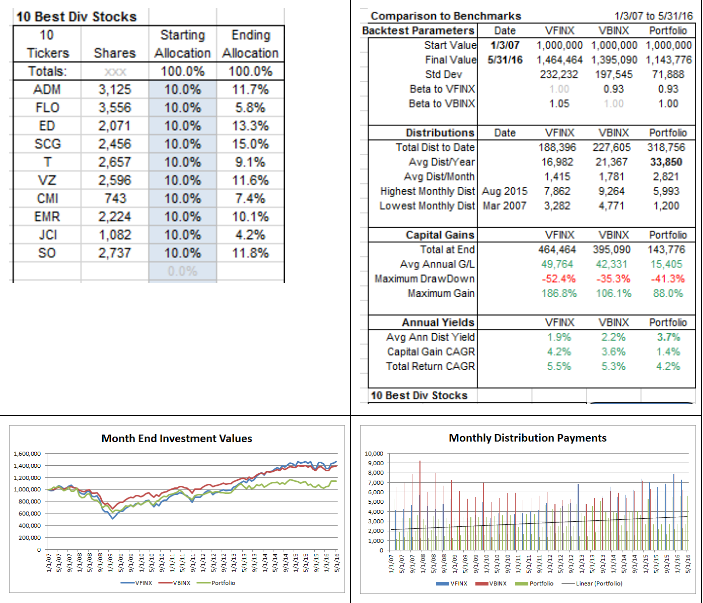
Not too bad. The income was consistent and increased with time. And there was no appreciable net capital loss over 9 � difficult years. But It displays many of the characteristics of Strategic Asset Allocation portfolios, including a terrible maximum drawdown during the 2008 bear market. Could this performance be improved? Probably. The �10 Best Dividend Stocks� portfolio did not include several major income groups recommended by Miller. If we added some REITs, MLPs, Baby Bonds, BDCs and Preferreds, I think we should be able to approach or exceed my 5% income goal with ease, and can probably reduce the max drawdown somewhat.
Conclusions
Income-only investing can probably do exactly what Miller claims: provide stable dividend income over a long time period without eroding capital. But I am uneasy about the large maximum draw-down in 2008. I think this investment method is best used in conjunction with a strategy aimed at preserving capital during down markets - Tactical Asset Allocation - and we all know who the TAA expert on this board is. But that�s just my humble opinion.
I don�t know about you, but 20-30 hours to build the initial portfolio and multiple hours at regular intervals to monitor and tweak seems like a lot of work - something a professional investor or obsessed retiree might be willing to tackle. Some of us probably fall into that category, but even the most obsessed need a break once in awhile. I suspect that the work involved in building and maintaining an income only portfolio can be significantly reduced by using more ETFs, CEF�s and/or OEFs, which should also reduce the overall portfolio risk. That will be the subject of another post.
In the meantime, RIP spreadsheet work continues so it can handle Preferred and mREIT testing. Another post will follow in a few weeks.
cancerfixer
|
||||||||
| |
More on the Retire In Peace (RIP) Portfolio