The 5 Best Mid Caps
Jul. 21 2015, 2:17 PM ET - by VF member vanmeerten (903
Today I used Barchart to sort the S&P 400 Mid Cap Index stocks to find with the most consistent upward prices momentum then used the Flipchart feature to review the charts.
Today's list includes Skechers (SKX), Thoratec (THOR), Jetblue Airways (JBLU), WisdomTree Investments (WETF) and Manhattan Associates (MANH).
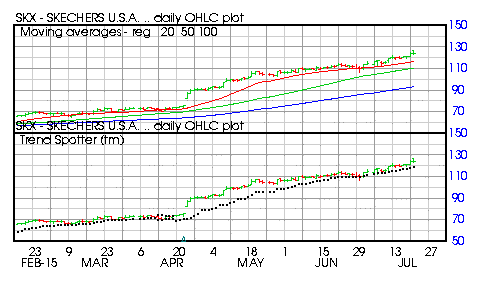
Skechers (SKX)
Barchart technical indicators:
96% Barchart technical buy signals
Weighted Alpha of 156.00+
Trend Spotter buy signal
Above its 20, 50 and 100 day moving averages
9 new highs and up 10.98% in the last month
Relative Strength Index 75.47%
Barchart computes a technical support level at 119.95
Recently traded at 123.75 with a 50 day moving average of 110.50
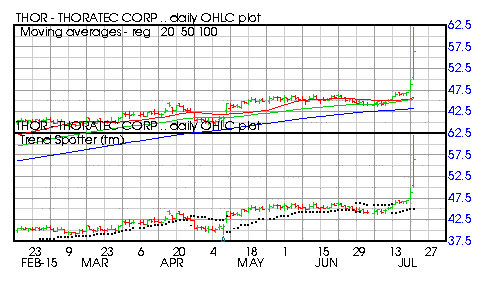
Thoratec (THOR)
Barchart technical indicators:
100% Barchart technical buy signals
Weighted Alpha of 114.37+
Trend Spotter buy signal
Above its 20, 50 and 100 day moving averages
6 new highs and up 22.99% in the last month
Relative Strength Index 88.41%
Barchart computes a technical support level at 46.10
Recently traded at 56.13 with a 50 day moving average of 45.53
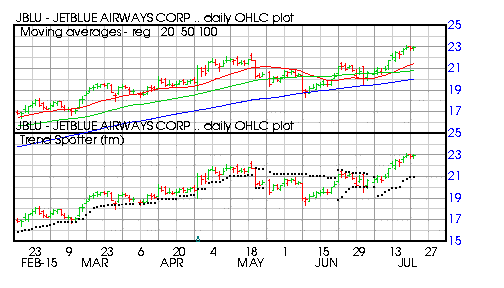
Jetblue Airways (JBLU)
Barchart technical indicators:
96% Barchart technical buy signals
Weighted Alpha of 104.87+
Trend Spotter buy signal
Above its 20, 50 and 100 day moving averages
7 new highs and up 13.45% in the last month
Relative Strength Index 68.51%
Barchart computes a technical support level at 22.51
Recently traded at 23.03 with a 50 day moving average of 20.80
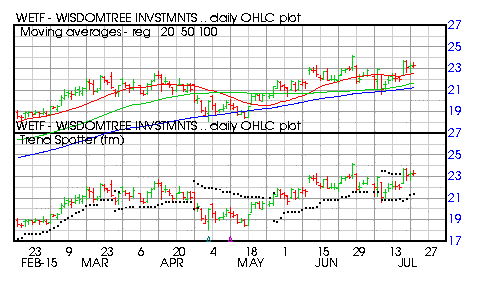
WisdomTree Investments (WETF)
Barchart technical indicators:
96% Barchart technical buy signals
Weighted Alpha of 96.51+
Trend Spotter buy signal
Above its 20, 50 and 100 day moving averages
5 new highs and up 5.87% in the last month
Relative Strength Index 56.40%
Barchart computes a technical support level at 22.33%
Recently traded at 23.10 with a 50 day moving average of 21.67
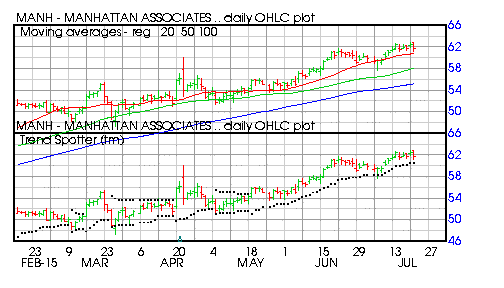
Manhattan Associates (MANH)
Barchart technical indicators:
80% Barchart technical buy signals
Weighted Alpha of 96.48+
Trend Spotter buy signal
Above its 20, 50 and 100 day moving averages
5 new highs and up 2.29% in the last month
Relative Strength Index 61.06%
Barchart computes a technical support level at 61.50%
Recently traded at 61.63 with a 50 day moving average of 58.04
|
||||||||
| |
The 5 Best Mid Caps