Popular Stocks Weak
Jun. 30 2015, 11:48 AM ET - by VF member vanmeerten (903
Although the Market is up ever so slightly today, as I write this article 56.71% of all stocks are trading below their 100 day moving averages. We are not in a Market panic mode but some caution is advised.
Today, I'd like to review the numbers on a few of the stock that hold the attention of the readers of Seeking Alpha and Motley Fool: Ford (F), Citigroup (C), Intel (INTC), Cisco (CSCO) and Google (GOOG). All 5 have a Relative Strength Index below 50%.
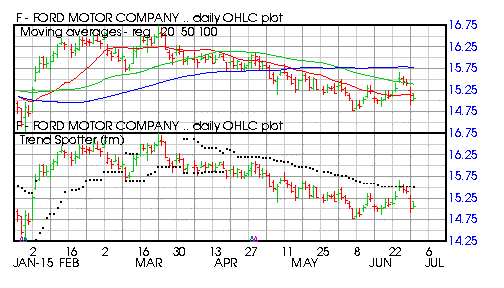
Ford (F)
Barchart technical indicators:
80% Barchart technical sell signals
Trend Spotter sell signal
Below its 20, 50 and 100 day moving averages
16.94% off its 52 week high
Relative Strength Index 44.00%
Recently traded at 15.03 which is below its 50 day moving average of 15.39
Citigroup (C)
Barchart technical indicators:
Barchart technical Hold signal
Trend Spotter sell signal
Below its 20 day but above its 50 and 100 day moving averages
Only 4.18% off its 52 week high
Relative Strength Index 45.77%
Recently traded at 55.22 with a 50 day moving average of 54.91
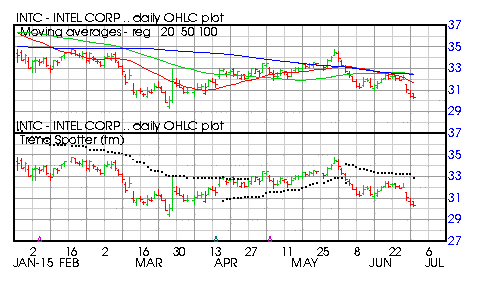
Intel (INTC)
Barchart technical indicators:
88% Barchart technical sell signals
Trend Spotter sell signal
Below its 20, 50 and 100 day moving averages
20.22% off its 52 week high
Relative Strength Index 31.68%
Recently traded at 30.42 which is below its 50 day moving average of 32.48
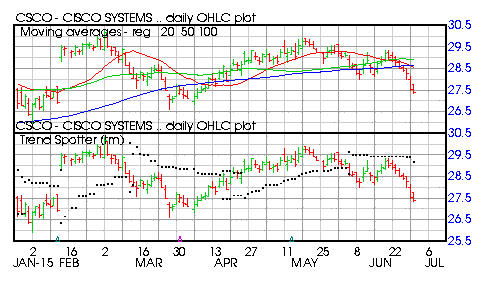
Cisco (CSCO)
Barchart technical indicators:
88% Barchart technical sell signals
Trend Spotter sell signal
Below its 20, 50 and 100 day moving averages
9.47% below its 52 week high
Relative Strength Index 29.45
Recently traded at 27.47 which is below its 50 day moving average of 28.91
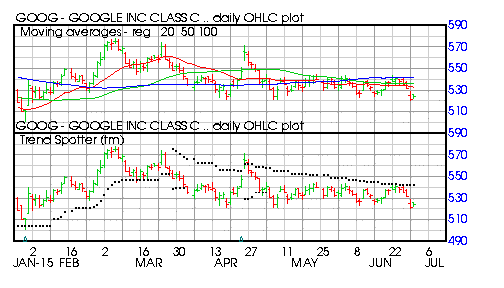
Google (GOOG)
Barchart technical indicators:
96% Barchart technical sell signals
Trend Spotter sell signal
Below its 20, 50 and 100 day moving averages
12.66% off its 52 week high
Relative Strength Index 40.27%
Recently traded at 524.11 which is below its 50 day moving average of 536.26

|
||||||||
| |
Popular Stocks Weak